The Time Has Come for IT Operations Analytics — Part 3
Why you should be using a single plane of glass to understand how IT and business operations interact.


In the previous installment in this blog series, I discussed the practical applications of using IT Operations Analytics (ITOA) technologies in the real world. In this installment, I’ll introduce Splunk and discuss how its platform delivers the benefits of ITOA.
Introducing Splunk
Splunk unleashes the power of machine data to help with IT operations, application and business operations monitoring. All of this is achieved in a single and highly-scalable platform that allows organizations to not only see their IT operations in a single platform, but can be extended to empower security operations and business analytics as well.
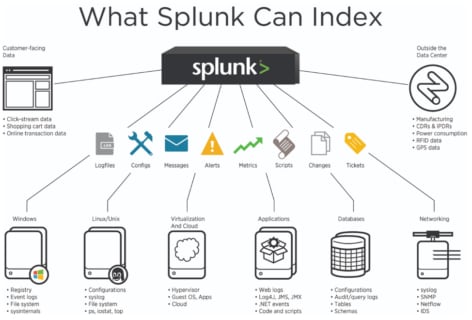
The first key component to Splunk’s secret sauce is its ability to ingest and index an impressive array of data. Disparate data in varying formats are collected by Splunk and are typically done so in their raw format, meaning there’s no need to understand the data before it goes into Splunk. Once the data goes into Splunk’s indexer it is ready to be searched, analyzed, alerted on and visualized in seemingly endless ways.
This visual demonstrates just how inclusive the data sources that Splunk can index really are.
Click to enlarge the image. Source: SlideShare
ITOA is all about allowing IT operations to adapt and thrive at the speed of business. With the complex infrastructures supporting these ever-changing business needs, it’s more crucial now than ever for IT operations organizations to understand the nuances of their infrastructure and services. The best way to understand the complicated context produced by an array of infrastructure and services is to look at it from a single pane of glass.
Using the Single Pane of Glass
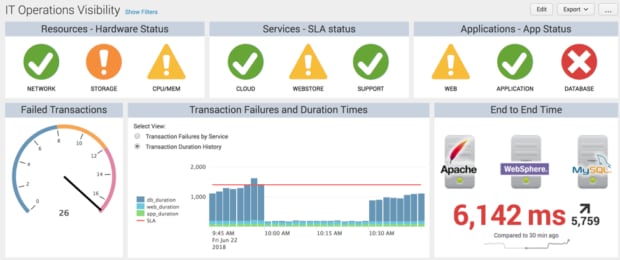
With Splunk’s ability to index an almost inexhaustible array of data sources combined with their outstanding visualization and alerting capabilities, users can begin to not only spot problems but can get out ahead of them and prevent them altogether.
An IT operations visibility dashboard such as this one is a powerful tool for understanding not only where problems exist but, just as importantly, where they don’t. The days of the all-hands-on-deck conference calls and checking of product-specific monitoring portals can be a thing of the past.
Click to enlarge the image. Source: Splunk
Keeping IT and LOB on the Same Page
As stated in my previous post, ITOA isn’t just about IT. The model of business and IT working in isolation is unsustainable in the current market climate. For IT to operate efficiently in support of the business it’s crucial that the IT team understand how the business is affecting the services they’re providing.
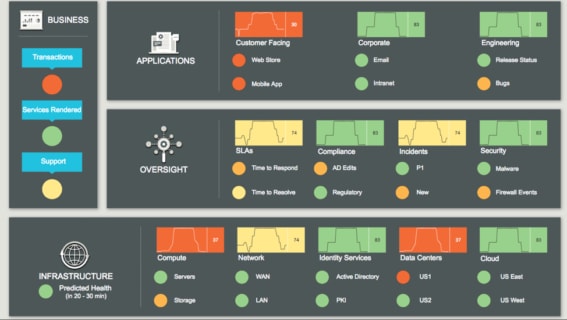
Splunk’s ability to monitor data in real time means users can see how business operations and IT operations are affecting one another as changes are made in either.
Producing a glass table view such as this one in a tool such as Splunk’s IT Service Intelligence application allows users to monitor their IT services with a clarity that historically has been very hard to achieve.
Click to enlarge the image. Source: Splunk
Splunk’s breadth of capabilities encapsulated in a single platform really lends itself to hitting on all the pillars of what ITOA should provide to any organization. And keep in mind that CDW is an Elite-level Splunk partner and we have the resources and capabilities to help you from the discovery and scoping phase all the way through implementation and ongoing support.